Source of article The Jury Room - Keene Trial Consulting.
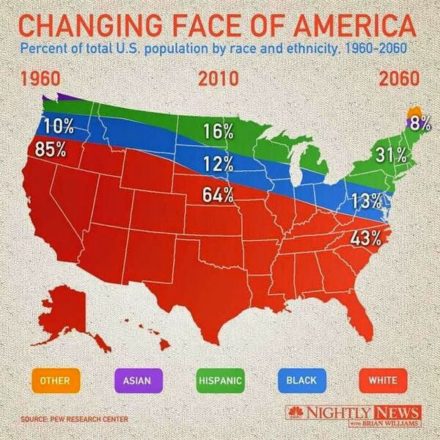
 We pay close attention to the changing demographics here in the US in general and particularly in the venues that involve our client cases. We want to keep abreast of how the country as a whole is shifting but need to be aware of the demographics of each area in which we are working. We check venire demographics each time (even if it is an area we’ve worked in recently) to ensure our recruit for pretrial research matches the demographics of the area–and thus, a selection that resembles the group of citizens likely to be appear for jury duty.
We were glad to see these updates on both the Hispanic and the Asian populations here in the US from the Pew Research Center. If you’re a regular here, you know we rely on their careful and accurate reports to keep us up on shifting attitudes, beliefs and values as well as how demographics are changing across the country.
This is how they begin their recent update on American Hispanics.
The Latino population in the United States has reached nearly 58 million in 2016 and has been the principal driver of U.S. demographic growth, accounting for half of national population growth since 2000. The Latino population itself has evolved during this time, with changes in immigration, education and other characteristics.This summary draws on a statistical portrait of the nation’s Hispanic population, which includes trends going back to 1980.
They point out that while the overall growth of the Hispanic population in the US has slowed, the American Hispanic population originates in many more different countries than previously. More American Hispanics are college-educated, more speak Spanish at home, and while California remains the state with the largest Hispanic population in the US—Texas is in second place and the Hispanic population in Texas is now growing faster than in California. You will want to read this entire (short) report and leave some time to play around with the interactive charts that will give you a clearer sense of how American Hispanic populations are changing.
And their information on Asian demographics and the many, many, many identifiable Asian subgroups is astounding!
Pew begins their update on changing demographics of Asian-Americans with the information that the Asian population in this country is incredibly diverse.
“The U.S. Asian population grew 72% between 2000 and 2015 (from 11.9 million to 20.4 million), the fastest growth rate of any major racial or ethnic group. By comparison, the population of the second-fastest growing group, Hispanics, increased 60% during the same period.”
They go on to say that we now have more than 20 million Asian-Americans who “trace their roots to more than 20 countries in East and Southeast Asia and the Indian subcontinent”. That’s a lot. So. Close your eyes and quickly name as many Asian countries as you can from which you think Asian-Americans have originated. We’ll wait.
So did you get to 19 countries? According to Pew—“the 19 largest origin groups together account for 94% of the total Asian population in the US”. They offer fact sheets on all 19 countries of origin so that if you are preparing for litigation in an area with a high population of Asian-Americans from Hmong (for example)—they have a fact sheet for you—and for the other 18 countries from which Asian-Americans tend to originate. It’s an incredible resource to educate you on how things are now (as opposed to how they were 10 or even 5 years ago).

