
Source of article The Jury Room - Keene Trial Consulting.
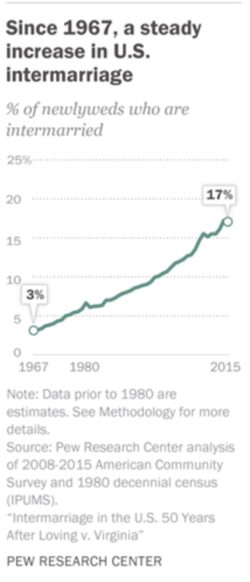 Recently we saw the 50th anniversary of the Supreme Court case Loving v. Virginia (1967) which ruled marriage across racial lines was legal throughout the US. In honor of this milestone, Pew Research Center has released a series of articles examining intermarriage in the US. We think it a good use of blog space to update you on the frequency of intermarriage in this country (which is rising—just like the US population is becoming increasingly racially diverse).
Less than a year ago (September 2016) , we posted on those who find interracial marriage “icky” so here are some prevalence numbers on intermarriage in the US. This posts reviews just a few of the pieces of information Pew shares across four different articles:
Intermarriage:
10% of married Americans in 2015 had a spouse of a different race or ethnicity. Pew says that translates into 11M intermarried people in the US.
Since 1980, the percentage of Blacks who married someone of a different race or ethnicity has tripled (from 5% to 18%).
Whites have also experienced a dramatic increase in intermarriage since 1980 (from 4% to 11%) but they remain the least likely of all major racial and ethnic groups to marry someone of a different race or ethnicity.
Asian (29%) and Hispanic (27%) newlyweds are the two most likely groups to intermarry. Of those newlyweds who were also born in the US, the percentages are even high among Hispanics (39%) and Asians (46%).
Male Black newlyweds (24%) are more likely than female Black newlyweds (12%) to intermarry. The opposite gender patter is true for Asian newlyweds with 36% of Asian women intermarrying compared with 21% of Asian male newlyweds. (Pew says the gender comparisons among White and Hispanic newlyweds who intermarry are roughly similar.)
As the prevalence of intermarriage increasing, American attitudes toward intermarriage have also become more accepting. In the past 7 years, says Pew, the number of Americans saying marrying someone of a different race is good for society has risen from 24% to 39%. Similarly, opposition to intermarriage is undergoing an even more dramatic decline according to Pew—although there is a sharp partisan divide in attitudes toward intermarriage. (Democrats and Independents leaning Democrat (49%) say intermarriage is a good thing for our society but only 28% of Republicans and Independents leaning Republican agree.)
Intermarriage also varies by education with 46% of Hispanic newlyweds with a college degree intermarrying (as compared to 16% with a high school diploma or less). Among Black newlyweds with a college degree, 21% intermarry compared to those with some college (17%) or a high school diploma or less (15%).
Cohabitation with a partner of a different race or ethnicity
Cohabitation is on the rise (6%) in the US, while marriage is declining (although half of American adults are married). Cohabitants with a partner of a different race or ethnicity (18%) are similar in number to married people in the US (17%) in an intermarriage.
Cohabitation with someone of a different race or ethnicity also varies by age or generation. It is likely not surprising that Millennials and GenXers (about 20% each) have a higher rate of living with a partner of a different race or ethnicity than do Boomers (13%) and Silents (9%).
Cohabitation also varies by race and ethnicity (much like marriage) in the US. White adults are least likely to cohabit with a partner of a different race or ethnicity (12% compared with 11% of White newlyweds). Black cohabitants (20%) and Hispanic cohabitants (24%) also loosely mirror the intermarriage rates among Black (18%) and Hispanic (27%) newlyweds. Asian cohabitants with partners of a different race or ethnicity (46%)show a very different pattern from Asian newlyweds (29%).
Education level and cohabitation mirrors the numbers among newlyweds with a partner of a different race or ethnicity, with those with more education somewhat more likely to have a significant other of a different race or ethnicity.
Metropolitan area variations in intermarriage
It is likely not surprising that intermarriage is more common in metropolitan areas (18% of newlyweds) than in rural areas (11%).
There is huge variation in metro areas with Honolulu, Hawaii (42%) having the highest share of intermarried newlyweds, compared to Las Vegas, Nevada and Santa Barbara, California coming in at a tie for second (at around 30%). These are all very racially and ethnically diverse areas and Pew thinks the diversity contributes to higher intermarriage rates.
Intermarriage is also typically more common among members of the military and thus metropolitan areas with military bases nearby often have higher rates of intermarriage.
On the low-end in terms of frequency, you will see only 3% of newlyweds intermarry in Jackson, Mississippi and Asheville, North Carolina. Pew also reports rates in Greenville, South Carolina and Birmingham, Alabama (each about 6%), Chattanooga, Tennessee (5%), and Youngstown, Ohio (4%). Pew introduces some interesting numbers on population diversity here. While Jackson and Birmingham have fairly diverse populations—Asheville and Youngstown do not.
Pew explains by citing the geographical disparity in the number of those who say more interracial marriage is bad for society. Unlike in the West (4%) and Northeast (5%)—there are higher numbers of people disapproving of intermarriage in the South (13%) and the MidWest (11%). If you are curious about specific numbers for various metropolitan areas, Pew has that too!
From a litigation advocacy perspective, if race or ethnicity is a factor in your case (either salient or not salient with non-salient being the most dangerous in terms of racial biases)—this is a good resource to use to draw initial hypotheses (for testing in pretrial research) regarding which jurors may be least biased against your case facts.
Before we had this kind of data, we would ask ourselves some simple questions that still appear to be worthwhile, based on the research.
Which jurors are likely to have had genuine relationships with people
Which jurors are likely to show more open-mindedness toward my client?
Which people are likely to be uncomfortable or opposed to intermarriage?
The research is largely what would have been predicted. If there is somehow an issue in your case about intermarriage, younger and better-educated people are more tolerant, while older and less well-educated are most opposed. Maybe it is simply a function of exposure and life experience, or discomfort with the pace of social change in those who may be more rooted in the past. In any case, intolerance has to be considered a factor.
May 18, 2017. Intermarriage across the US by metro area. http://www.pewsocialtrends.org/interactives/intermarriage-across-the-u-s-by-metro-area/
May 18, 2017. In US metro areas, huge variation in intermarriage rates. http://www.pewsocialtrends.org/interactives/intermarriage-across-the-u-s-by-metro-area/
May 18, 2017. Intermarriage in the U.S. 50 Years After Loving v. Virginia. http://www.pewsocialtrends.org/2017/05/18/intermarriage-in-the-u-s-50-years-after-loving-v-virginia/
June 8, 2017. Among US cohabiters, 18% have a partner of a different race or ethnicity. http://www.pewresearch.org/fact-tank/2017/06/08/among-u-s-cohabiters-18-have-a-partner-of-a-different-race-or-ethnicity/
